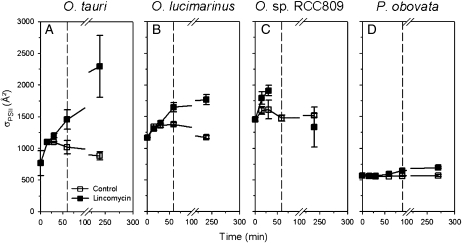
Figure 4.
Changes in PSII effective absorption cross section, estimated from flash fluorescence rise kinetics, in the four prasinophytes during 60 to 90 min of exposure to high light followed by a 3-h recovery period. White symbols represent control culture, and black symbols represent lincomycin-treated culture (n = 4 ± se). The dashed line delineates the high-light treatment and recovery periods.

