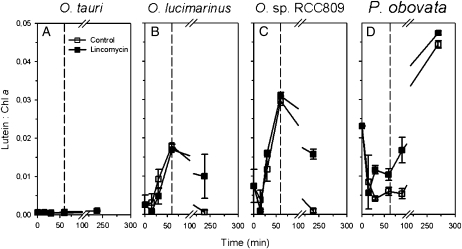
Figure 7.
Changes in lutein-to-Chl a ratio in the four prasinophytes during 60 to 90 min of exposure to high light followed by a 3-h recovery period. White symbols represent control culture, and black symbols represent lincomycin-treated culture (n = 4 ± se). The dashed line delineates the high-light treatment and recovery periods.

