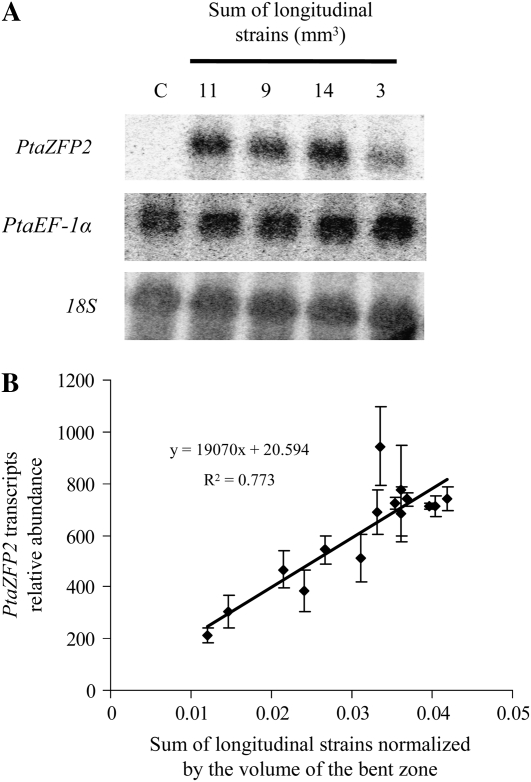
Figure 7.
Expression analysis of the poplar PtaZFP2 gene by northern blot and the relationship between the level of expression of PtaZFP2 (quantified by real-time quantitative RT-PCR) and the applied strain. A, Northern-blot analysis revealed the induction of PtaZFP2 transcript accumulation 30 min after stem bending on five representative stem samples. Total RNAs (15 μg) were separated on a formaldehyde gel, blotted, and probed with 32P-labeled PtaZFP2 gene-specific probe. RNAs were extracted from the 3-cm-long bent part of the stems that were subjected to different levels of strains as indicated or from the same stem portion on the control (not bent) plant (C). Expressions of PtaEF-1α and 18S rRNA were used as loading and transfer controls. B, Real-time quantitative RT-PCR analysis of the expression of PtaZFP2 in 15 stems bent within a range of standardized sums of applied strains from 0.012 to 0.042. Each point corresponds to one plant. All values were standardized to PtaEF-1α transcript levels. Errors bars correspond to se. The expression level of PtaZFP2 was correlated with the standardized sum of longitudinal strains. The relative abundance of PtaZFP2 transcripts increased linearly with the increase of the standardized sum of applied strains.

