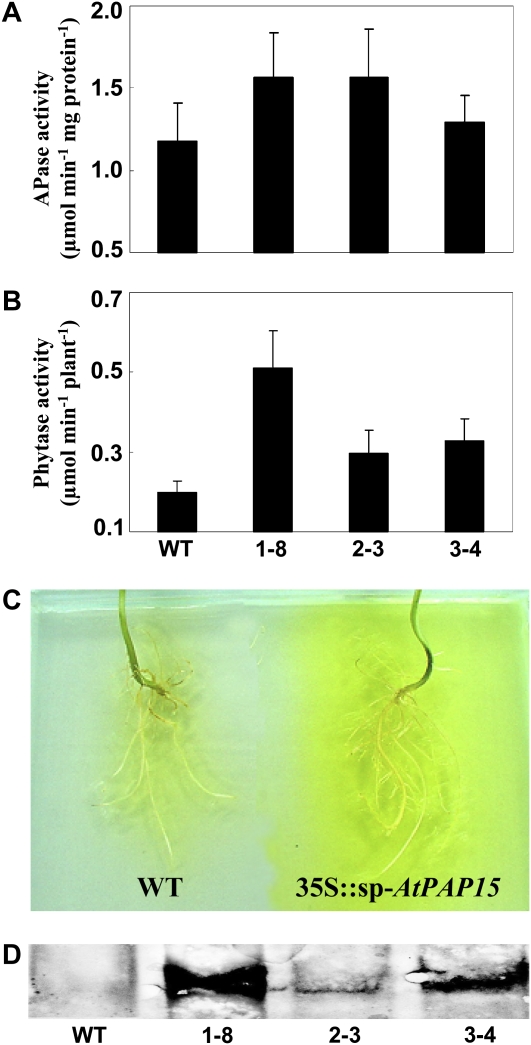
Figure 5.
APase and phytase activities in transgenic soybean plants. A, APase activity in leaves. B, Phytase activities in root exudates of different transgenic lines. Data in the figure are the mean of three replicates ± se. C, Exudation of APase activity in transgenic (right) and wild-type (left) soybean. The yellow color indicates APase enzyme activity in root exudates. D, Detection of AtPAP15 protein in root exudates by western-blot analysis. WT, Wild-type soybean; 1-8, 2-3, and 3-4, plants transformed with AtPAP15.

