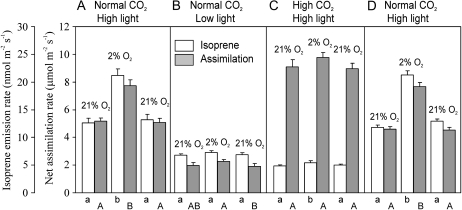
Figure 5.
Influence of O2 concentration on isoprene emission (white bars) and net assimilation (gray bars) rates at different quantum flux densities and ambient CO2 concentrations in the hybrid aspen leaves. High light corresponds to 550 μmol m−2 s−1 and low light to 200 μmol m−2 s−1, while normal CO2 concentration corresponds to 350 μmol mol−1 and high CO2 to 1,150 μmol mol−1. Leaf temperature was 28°C to 30°C in all experiments. Error bars denote se (n = 5). Lowercase letters indicate significant (P < 0.05) differences among the isoprene emission rates within a given panel (paired samples t test), while uppercase letters denote the differences among the net assimilation rates. The order of bars denotes the sequence of environmental changes for each individual leaf. Each leaf was kept at each set of environmental conditions until the steady-state rates of isoprene emission and net assimilation rate were observed. The conditions for A and D were the same to test whether the physiological status of the leaf changed during the experiment. In none of the pairwise comparisons were the average isoprene emission and net assimilation rates different between the corresponding treatments among A and D (P > 0.6).

