
Figure 3. PIP2 quenching of GTTR but not TR fluorescence.
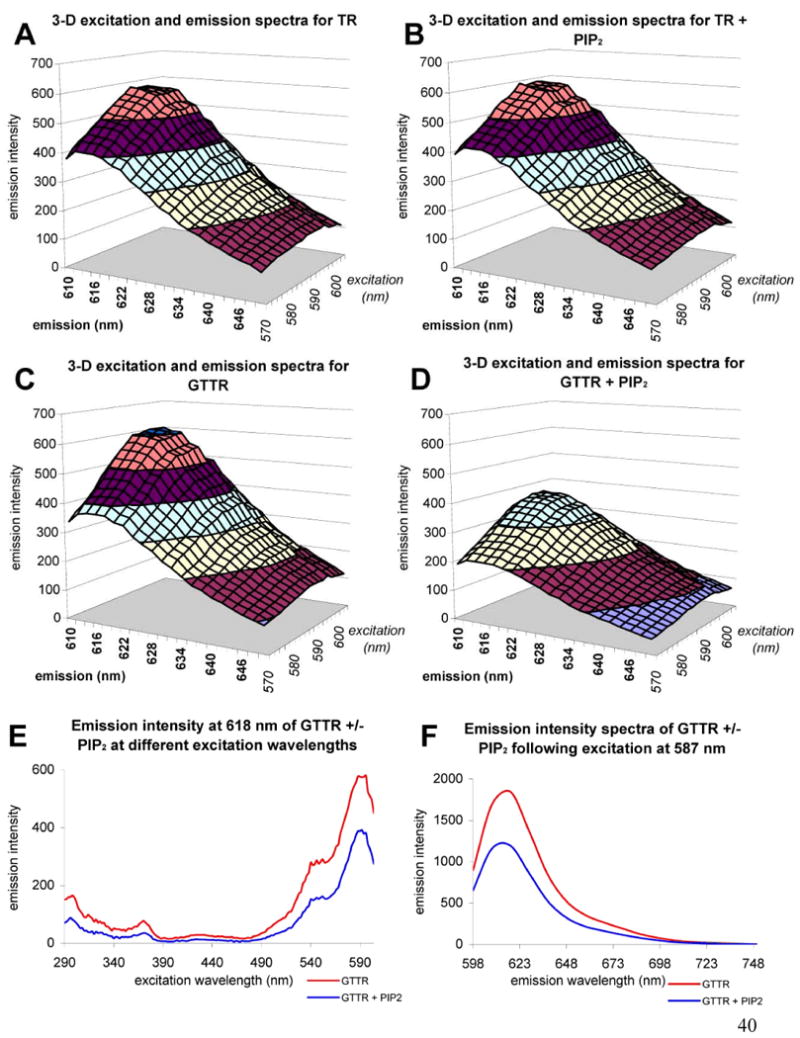
A-D) 3-dimensional excitation and emission scans; excitation 570-640 nm, emission 610-650 nm, bandwidth = 5 nm, emission intensity in arbitrary fluorescent units. A) Texas Red. B) Texas Red in the presence of PIP2. Note the similarity of the spectra to that seen in A). C) GTTR. D) GTTR in the presence of PIP2. Note the reduced fluorescence emission intensities compared to C). E) Emission scan of GTTR at 618 nm (bandwidth = 5 nm) in the absence (red) or presence (blue) of PIP2 over the excitation wavelength range 290-604 nm. F) Emission scan of GTTR at the fixed excitation wavelength 587 nm (bandwidth = 5 nm) over the emission wavelength range 598 – 748 nm (bandwidth = 5 nm) in the absence (red) or presence (blue) of PIP2.