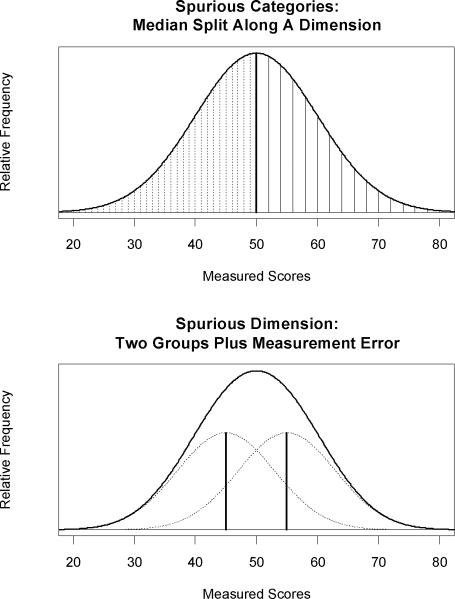
Fig. 1.
Graphs showing spurious categories (top) and a spurious dimension (bottom). In the top panel, a normally distributed dimensional variable is dichotomized at the median to split cases into “high” (solid line fill) and “low” (dotted line fill) groups, which discards variation in true scores along the underlying dimension. In the bottom panel, the overlapping score distributions for members of two groups (dotted curves) are the result of measurement error around the true scores for each group (dark vertical lines); in the full sample, the mixture of groups produces a unimodal distribution of observed scores (solid curve) that could be mistaken for evidence of a dimensional variable.

