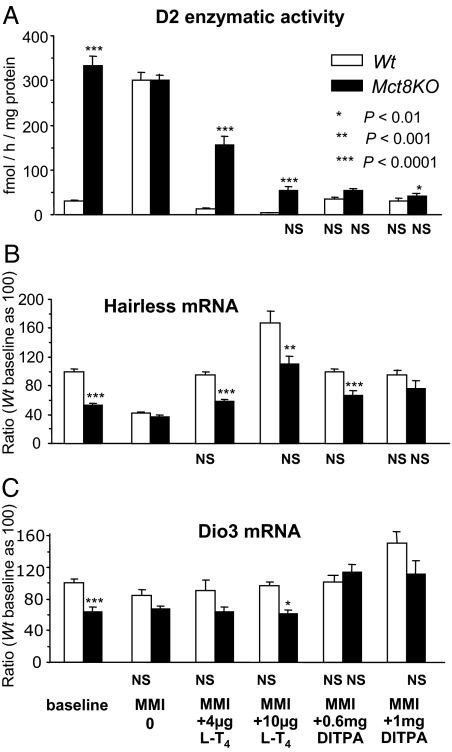
Figure 2.
Brain D2, Hr, and Dio3 at baseline and during treatment with l-T4 and DITPA. Data are expressed as mean ± se. Statistical differences between Wt and Mct8KO mice for each treatment group are indicated above the Mct8KO bars. Lack of statistical difference from the values in Wt mice at baseline are indicated below each value bar as NS (not significant). Treatment with LoI/MMI/ClO4 is simply indicated as methimazole (MMI) on the abscissa.

