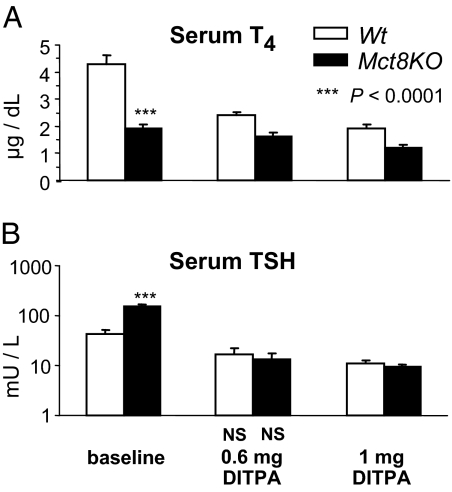
Figure 5.
Effect of DITPA on suppression of endogenous T4 and TSH in untreated mice. Data are expressed as mean ± se. Statistical differences between Wt and Mct8KO mice for each treatment group are indicated above the Mct8KO bars. Lack of statistical difference from the values in Wt mice at baseline are indicated below each value bar as NS (not significant). At baseline serum T4 was lower in Mct8KO than Wt mice. T4 and TSH declined with the administration of DITPA in both genotypes. The absolute value of TSH reached was not statistically different between the two genotypes.

