Figure 4.
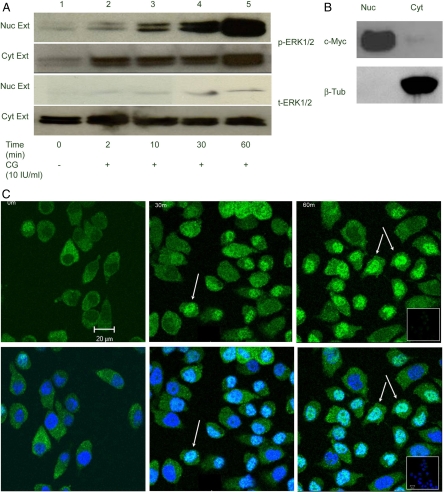
A, Nuclear translocation of p-ERK1/2. CG induced nuclear translocation of p-ERK1/2 in HES cells: A, Fractionation of cellular components was carried out as indicated in Materials and Methods. Western blot analysis of p- and t-ERK1/2 in 50 μg nuclear (Nuc Ext) and 40 μg of cytoplasmic extracts (Cyt Ext) of HES cells treated with 10 IU/ml CG for the times indicated are shown. Lanes 1–5 represent increasing treatment times of 0, 2, 10, 30, and 60 min. B, Fifty micrograms of nuclear and 40 μg of cytoplasmic extracts were analyzed by Western blot using antibodies against c-Myc and β-tubulin (β-Tub) to verify for purity of the cellular fractions. C, Immunofluorescent imaging of p-ERK1/2 upon CG stimulation: 90% confluent HES cells were treated with 10 IU/ml CG for 0, 30, and 60 min. They were analyzed using an immunocytochemistry-compatible p-ERK1/2 antibody and visualized using confocal microscopy. The green indicates p-ERK1/2 staining in the upper panels, and the lower panels in blue show an overlay with nuclear staining by DAPI. The nuclear localization of p-ERK1/2 after treatment with CG at 30 and 60 min are indicated by the arrows. All images are at the same magnification; the bar (A), 20 μm. The inset represents the IgG control. The experiments have been performed in triplicate and the images are the best representation of the data.

