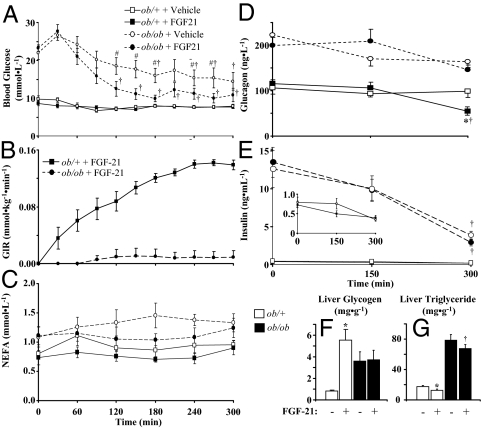
Figure 4.
Whole blood glucose (A), GIR (B), glucagon (C), and insulin (D) in ob/+ and ob/ob mice infused with FGF21 (1 ng · kg−1 · min−1) or vehicle for a total of 6 h (n = 7–9 in each group). Inset in E shows rescaled insulin levels for ob/+ mice. Samples were taken at time points indicated in each panel, and t = 0 is the mean of t = −15 and −5 min samples. Figures show data for the first 5 h before the bolus infusion of 2-DG at t = 318 min to measure tissue-specific glucose uptake. Glycogen (F) and triglyceride (G) were measured after euthanasia via a bolus of pentobarbital. Jugular vein catheters used for infusion purposes were surgically implanted in all mice 5 d before study, and blood samples were taken from the cut tail. All mice were male, studied at 9–10 wk of age, and fasted for 5 h before study. Data are presented as mean ± se, and statistical significance is established at P < 0.05. *, Differences between vehicle- and FGF21-infused ob/+ mice; #, differences between vehicle- and FGF21-infused ob/ob mice; †, differences compared with basal values.

