
Figure 3. Average differential gene expression profiles of the five groups of individuals.
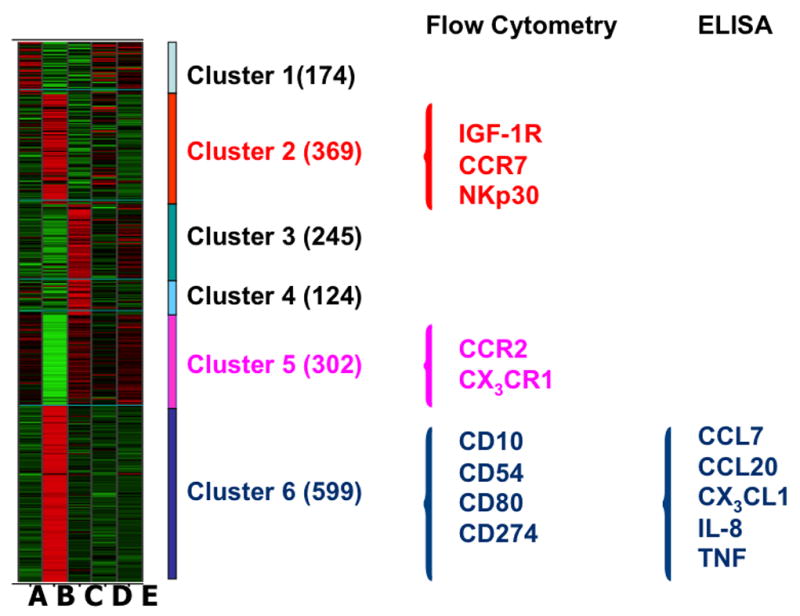
Using either flow cytometry (surface expression) or ELISA (secreted proteins) selected genes were validated based on their biological relevance (following literature-mining algorithms). Clusters 2, 5 and 6 were selected based on the identification of cell surface receptors and secreted proteins most relevant to HCV infection status.