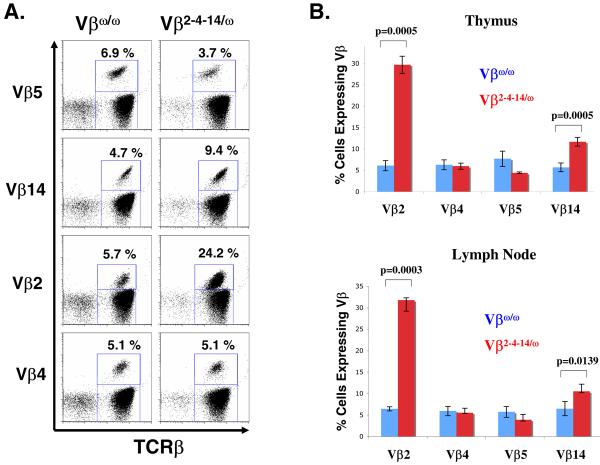
Figure 3. Altered Vβ repertoire in Vβ2-4-14/ω thymocytes and peripheral αβ T cells.
(A) Shown are representative TCRβ-PE and Vβ5-FITC, Cβ-PE and Vβ14-FITC, Cβ-PE and Vβ2-FITC, Cβ-PE and Vβ4-FITC FACS analyses of cells isolated from the lymph nodes of Vβω/ω and Vβ2-4-14/ω mice. The percentage of TCRβ positive αβ T cells that express each particular Vβ is indicated. (B) Bar graphs showing the average percentage of TCRβ positive thymocytes and lymph node cells that express Vβ2, Vβ4, Vβ5, or Vβ14.

