
Figure 6. Chk1 degradation and CPT sensitivity.
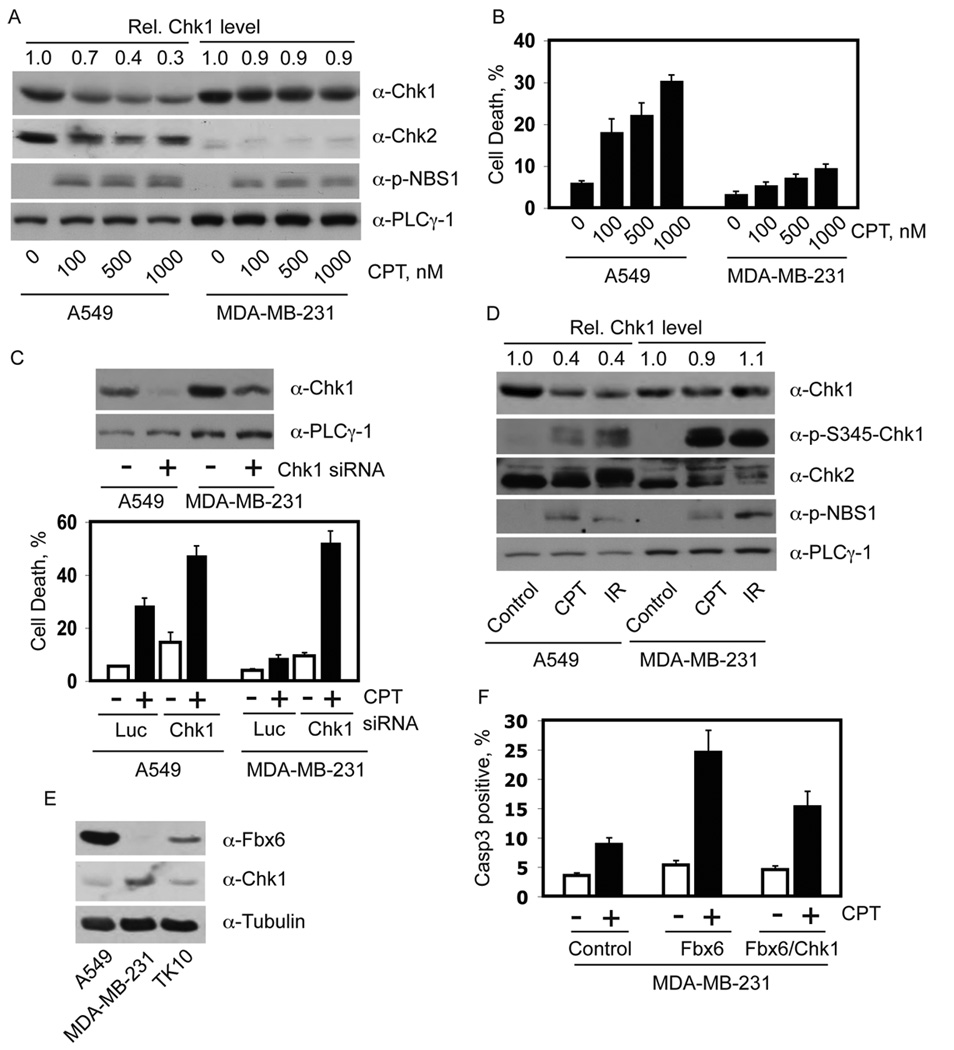
(A) Asynchronous A549 and MDA-MB-231 cells were treated for 8 h with the indicated concentrations of CPT. Protein expression was determined by immunoblotting with the indicated antibodies. Numbers at the top of each sample lane represent the relative Chk1 protein level, normalized to that obtained in the no-drug control. (B) Cells treated as described in panel A were cultured for 48 h in fresh medium. Cell death was determined by staining with trypan blue. The data are plotted as mean +/− standard deviation from 3 independent trials. (C) A549 and MDA-MB-231 cells were transfected for 48 h with the indicated siRNAs and treated with CPT. Upper panel, expression level of Chk1. Lower panel, Cell death after 36 h of release from CPT treatment. The data are presented as mean +/− standard deviation from three independent experiments. (D) Asynchronous A549 and MDA-MB-231 cells were treated with 500 nM CPT or 15 Gy IR. After 8 h, cell extracts were prepared and immunoblotted with the indicated antibodies. Numbers at the top of each sample lane represent relative Chk1 protein levels, normalized to that obtained in the non-treated control sample for each cell type. (E) Equal amounts of total proteins from exponentially growing A549, MDAMB-231, and TK-10 cells were blotted with purified rabbit anti-Fbx6 antibody first, then stripped and sequentially re-blotted with mouse anti-Chk1 and anti-tubulin antibodies. (F) MDAMB-231 cells grown on glass cover slides were transfected with control vector, Flag-Fbx6 only, or Flag-Fbx6 plus Myc-Chk1 expression vectors. After 48 h, cells were treated for 8 h with 500 nM CPT, and were released into drug-free medium for another 12 h; cells were then fixed and stained with anti-Flag and anti-Chk1 or anti-activated caspase 3 antibodies. The caspase 3 positive cells in control or Flag-Fbx6-expressing cells were counted; data represent mean +/− standard deviation from two independent experiments. At least 50 positive cells were counted in each experimental setting.