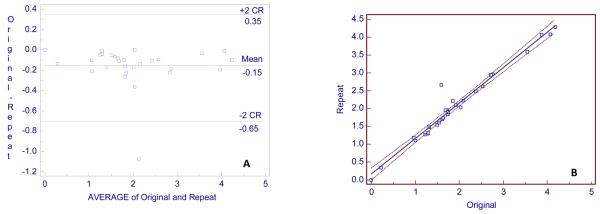
Fig. 3.
A, Bland and Altman plot for 29 CEJAC original and 29 repeat measurements (in mm) for 29 subjects. The y axis is the difference between original and repeat measurements and the x axis is the average of original and repeat measurements. B, Regression plot, with 95% confidence intervals, of repeat on original measurements. Regression equation: Repeat measurement =0.1696 +0.9921 original measurement (units = mm). R2 = 0.96, r = 0.98 (95% confidence interval, 0.96 to 0.99). CR = coefficient of repeatability.

