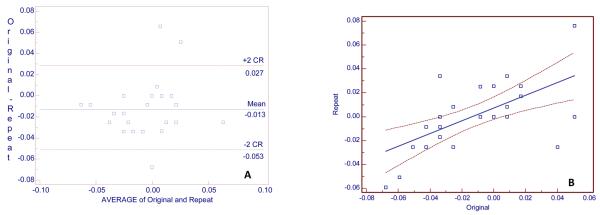
Fig. 4.
A, Bland and Altman plot of alveolar, crest-height for 27 original and 27 repeat measurements (in mm) for 27 subjects. The y axis is the difference between original and repeat measurements and the x axis is the average of original and repeat measurements. B, Regression plot, with 95% confidence intervals, of repeat on original measurements. Regression equation: Repeat measurement =0. 0.007 +0.53301 original measurement (units = mm). R2 = 0.38, r = 0.62 (95% confidence interval, 0.31 to 0.81). CR = coefficient of repeatability.

