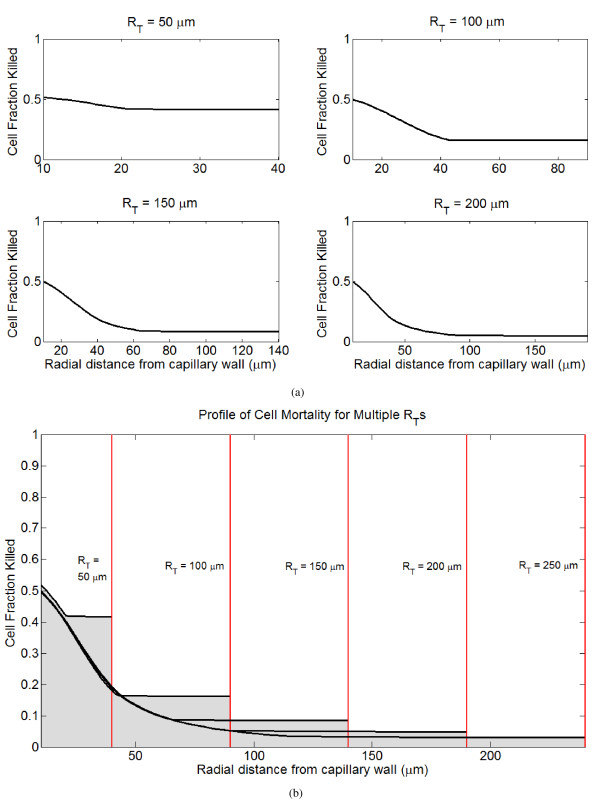
Figure 7.
Profiles of tumor cell mortality for a single infusion of 75 mg/m2 delivered as a rapid bolus in tumor cords with different radii (RT). (A) Spatial profiles of cell kill for different tumor cord radii. (B) Spatial profiles of cell kill for different tumor cord radii superimposed in the same plot.

