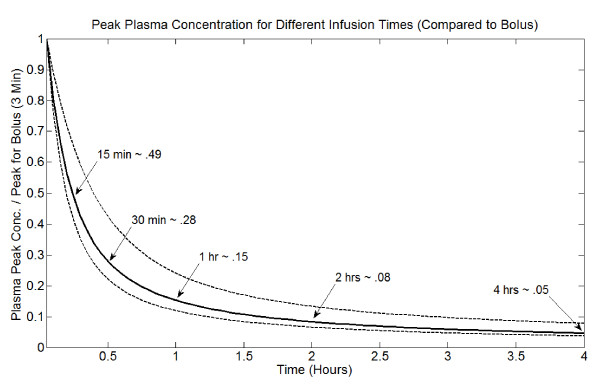
Figure 9.
Peak plasma DOX concentration for different infusion times, relative to rapid bolus (3 minutes). This curve depends on pharmacokinetic parameters; the center curve is the average for the 12 parameter sets reported by Robert et al. [20]. The minimum and maximum curves from this data-set are also shown.

