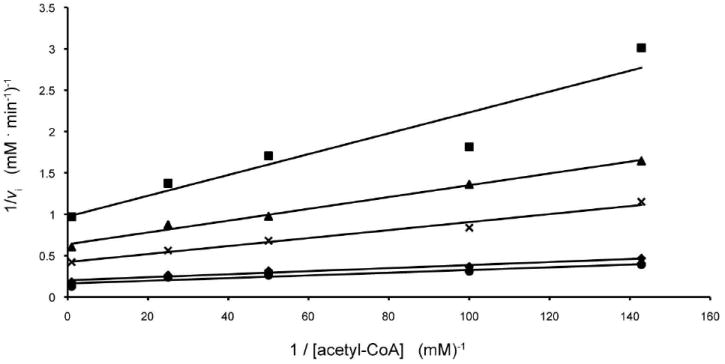
Figure 1.

Double reciprocal plots of initial rates of formation of CoA. In this plot, the concentration of acetyl-CoA is varied at several fixed concentrations of dTDP-d-Quip3N equal to 0.01 mM (square), 0.02 mM (triangle), 0.05 mM (cross), 0.2 mM (diamond), and 1.0 mM (circle).
