
Figure 4.
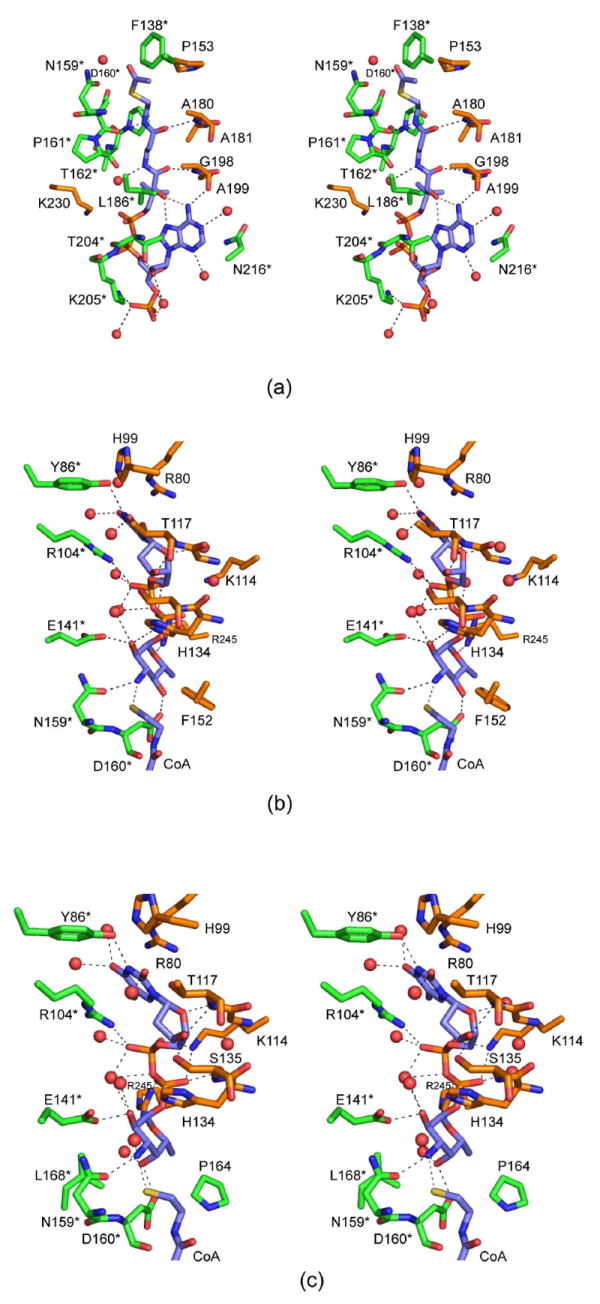
The QdtC active sites with bound ligands. (a) A close-up stereo view of the QdtC active site with bound acetyl-CoA is shown. The coenzyme is highlighted in blue bonds whereas the residues from two of the subunits in the trimer are displayed in gold and green. For the sake of clarity, only the side chains are displayed for those residues whose backbone atoms are not involved in hydrogen bonding to the ligand. Water molecules are depicted as red spheres. Possible hydrogen bonding interactions within 3.2 Å of CoA and the protein (or solvent) are indicated by the dashed lines. (b) A close-up view of the QdtC active site with bound CoA and dTDP-d-Quip3N is depicted. Given that the CoA binds in a nearly identical manner as that shown in (a), only the immediate region surrounding the nucleotide-linked sugar is shown. (c) A close-up view of the QdtC active site with bound CoA and dTDP-d-Fucp3N is displayed.