
Figure 5a - 5h.
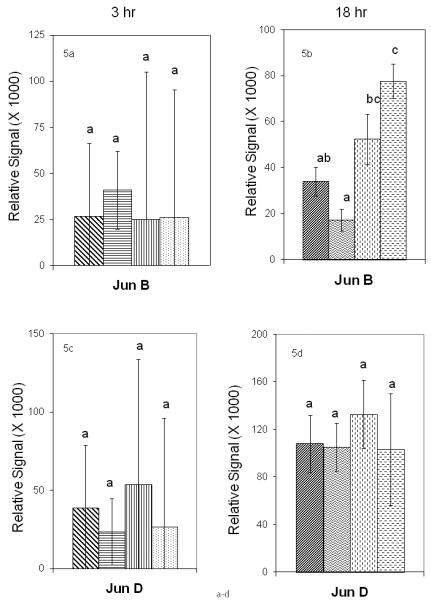
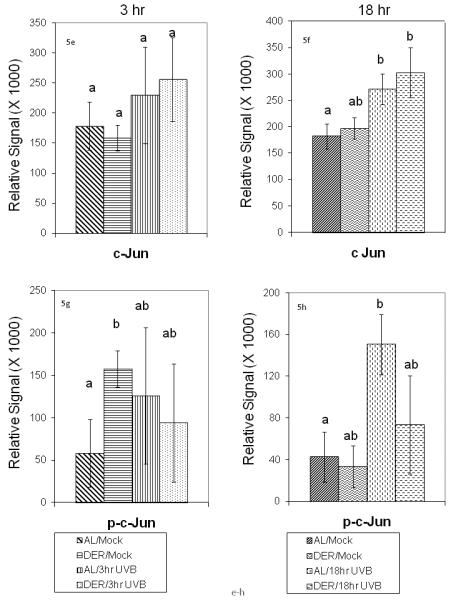
Effect of dietary energy restriction on UVB induced modulation of AP-1 jun constituent proteins at 3 and 18 hours after UVB treatment. Values represent the mean ± SE, N=8-11 mice for each data point). Differences between treatment groups for each protein were measured by two-way ANOVA. If two-way ANOVA showed a significant difference, individual means were analyzed by t-test. Results of t-tests are indicated by a<b and values with 2 letters are not different from values with either of the letters (P<0.05). Different proteins were not compared to one another.