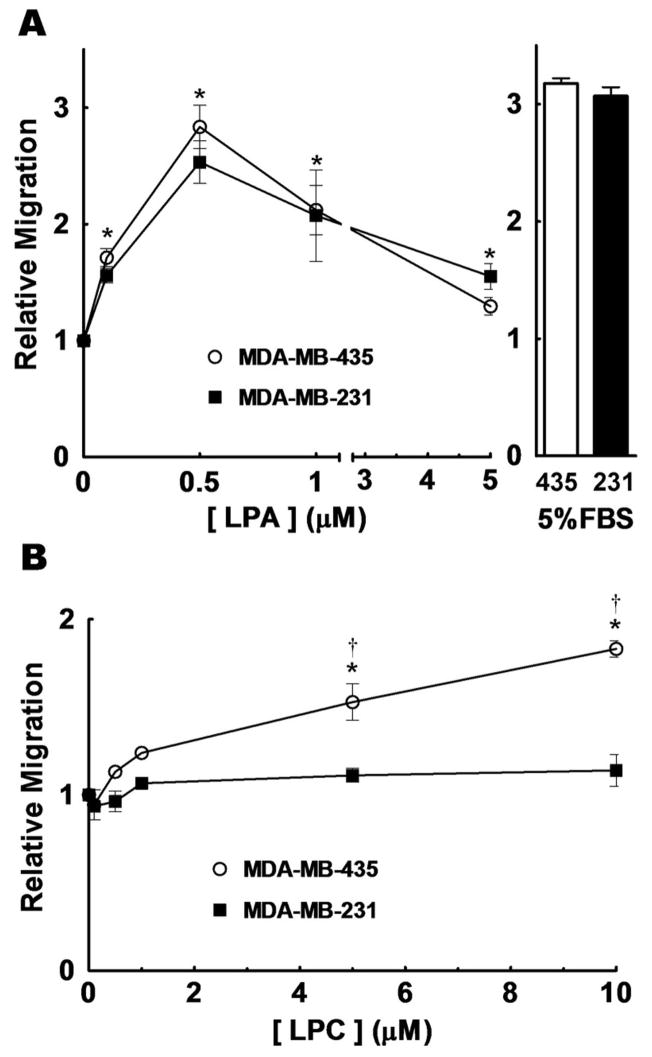
FIGURE 1.
Effects of lysophosphatidate and lysophosphatidylcholine on the migration of MDA-MB-435 and MDA-MB-231 cells. Panel A, shows the migration of MDA-MB-435 (○), and MDA-MB-231 (■) cells after a 3 h incubation with different concentrations of LPA. Migration in response to 5% charcoal-stripped FBS was used as a positive control. Panel B, shows migration when the cells were incubated for 6 h with different concentrations of LPC. Results are expressed relative to the number of cells migrating with only basal media (RPMI 1640 with 0.1% BSA and 0.2% FBS-C), which was given a value of 1. Typically, basal migration consisted of approximately 75 cells per field for a 3 h incubation and 120 cells per field for a 6 h incubation. Results are means ± SEM from at least 3 independent experiments. Statistically significant differences between basal migration and agonist-stimulated migration are indicated by * (p < 0.01) and between cell lines are indicated by: † (p < 0.01).

