
Figure 2.
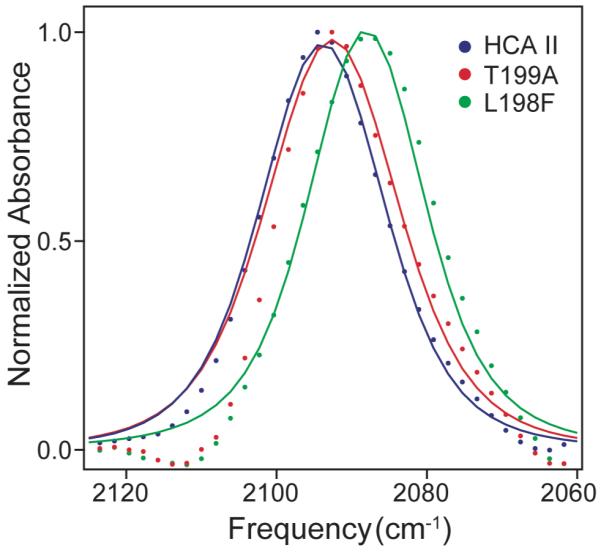
Infrared absorption spectra of azide bound to wild-type human Carbonic anhydrase II (HCA II) in blue, the Thr199→Ala mutant of HCA II (T199A) in red, and the Leu198→Phe mutant of HCA II (L198F) in green. The points are experimental data and the solid lines are calculated spectra using the fit parameters obtained from the global fit to the vibrational echo data for each enzyme.