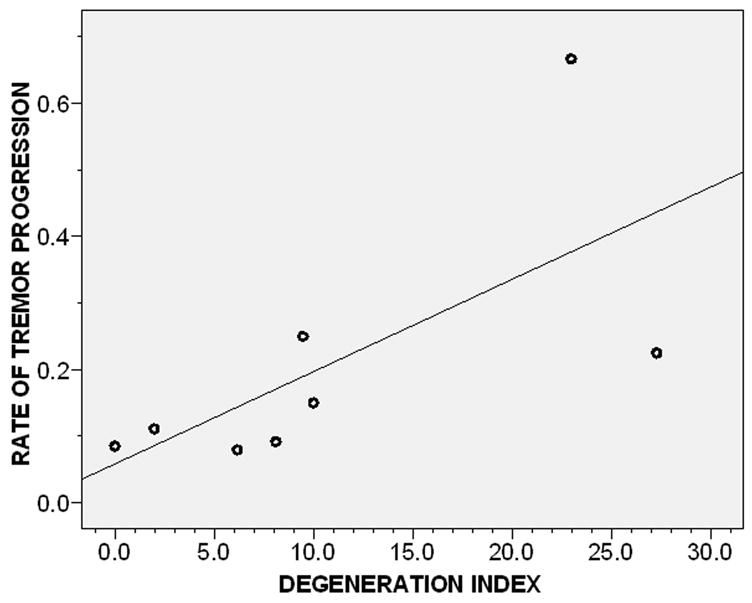
Figure 3.

Rate of tremor progression by degeneration index (Pearson’s r = 0.76, p = 0.03). The degeneration index was defined as the number of torpedoes per section divided by the Purkinje cell linear density. Complete spiral data were present in eight of nine ET cases. Fit line is shown.
