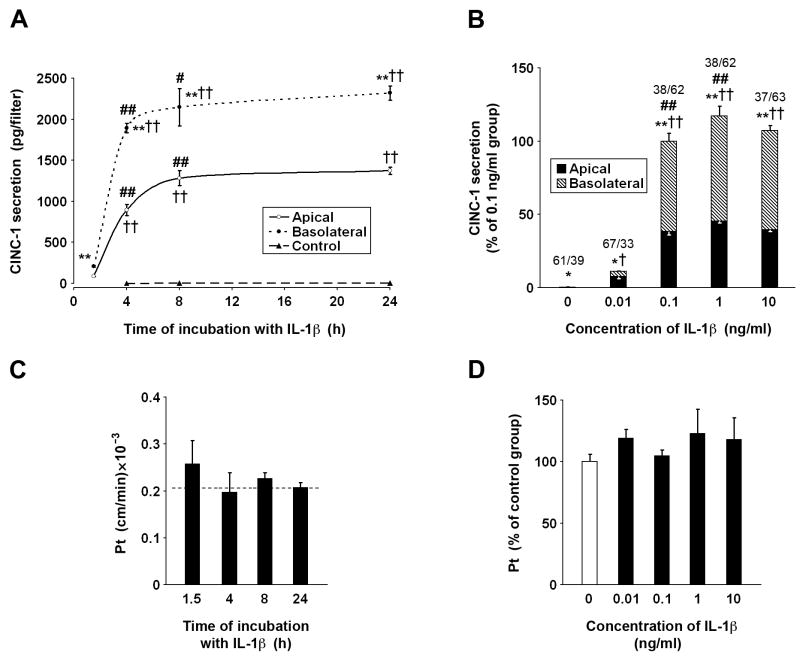
Figure 4.
Secretion of CINC-1 in primary cell cultures of rat choroidal epithelial cells. The cells were seeded on Transwell Clear inserts as described in Materials and methods. The experiments were performed 5 days after the cells reached confluence (n=3–6 per group). The apical surface of epithelial monolayers was exposed to IL-1β and the concentration of CINC-1 in the apical and basolateral chambers was quantified by ELISA. (A) The time-course studies. The cells were incubated with 0.1 ng/ml of IL-1β for up to 24 h. During the initial 4-h period ofexposure to IL-1β, the CINC-1 levels in the apical and basolateral chambers increased rapidly; however, between 4 and 8 h of incubation with this cytokine, the CINC-1 levels increased at much slower rate. (B) The dose-response studies. The cells were exposed to IL-1β for 8 h. The fractions above the columns represent the proportion (%) of apical vs. basolateral release of CINC-1 to the culture media. Under control conditions, CINC-1 was constitutively produced, but it was barely detectable, and the total amount of CINC-1 secreted to the apical and basolateral chambers during the 8-h observation period was ~6 pg/filter. This secretion was polarized, with CINC-1 being predominantly released across the apical (CSF-facing) membrane. Note that the exposure of epithelial monolayers to IL-1β at 0.1 ng/ml resulted in a large increase in CINC-1 synthesis, but the polarity of CINC-1 secretion was reversed and an approximately 2/3 of the chemokine produced by choroidal cells was secreted across the basolateral (stroma/blood-facing) membrane. All data represent mean values ± SD. *P<0.05, **P<0.01 for apical vs. basolateral CINC-1 secretion (Student’s t test with Bonferroni correction). †P<0.05, ††P<0.01 for CINC-1 secretion in response to IL-1β vs. control (Dunnett test). #P<0.05, ##P<0.01 for a difference in CINC-1 secretion at two consecutive time points during the exposure to IL-1β or in response to a 10-fold increase in IL-1β concentration (Tukey-Kramer test). The integrity of epithelial monolayers exposed to IL-1β was examined by measuring the permeability of each filter to the paracellular permeability marker 14C-sucrose (n=3–6 per group). The permeability × surface area product, PSt, was calculated from the 14C-sucrose clearance rates as described in Materials and methods. The permeability coefficient, Pt, was calculated by dividing PSt by the surface area of the cell monolayer. (C) Temporal changes in paracellular permeability during the exposure to 0.1 ng/ml of IL-1β. The dashed line represents the Pt value obtained in untreated cells. (D) Changes in paracellular permeability in response to varying concentrations of IL-1β during the 8-h incubation with the cytokine. No statistically significant differences were observed among the groups.

