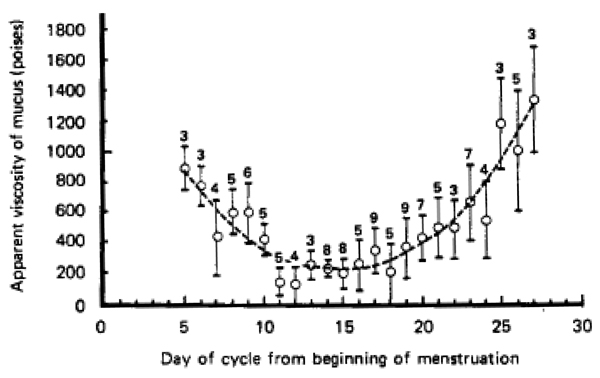
Figure 6.
Variations in the viscosity of cervical mucus from healthy, non-pregnant subjects with day in menstruation cycle (119 samples). The dotted line is drawn to emphasize the main feature of the graph. The number above each point indicates the number of samples averaged. Each vertical line indicates ± one standard deviation of individual readings about the mean. Figure obtained from [108].

