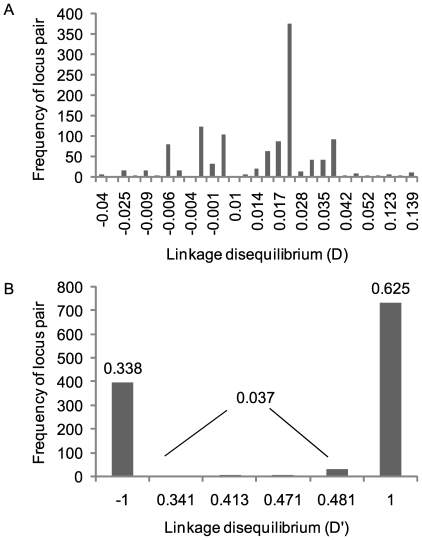
Figure 8. Linkage disequilibrium among study loci.
A). The distribution of the linkage disequilibrium coefficient (D) for 1,176 pairwise comparisons of alleles at 54 sSNP and intergenic SNP loci. A total of 751 (64%) of these comparisons are significant by a chi-squared test, and600 (51%) remained significant using a Bonferroni correction for multiple tests. B). The distribution of the standardized coefficient of linkage disequilibrium (D'). Ninety-six percent of the locus pairs are in complete linkage disequilibrium.

