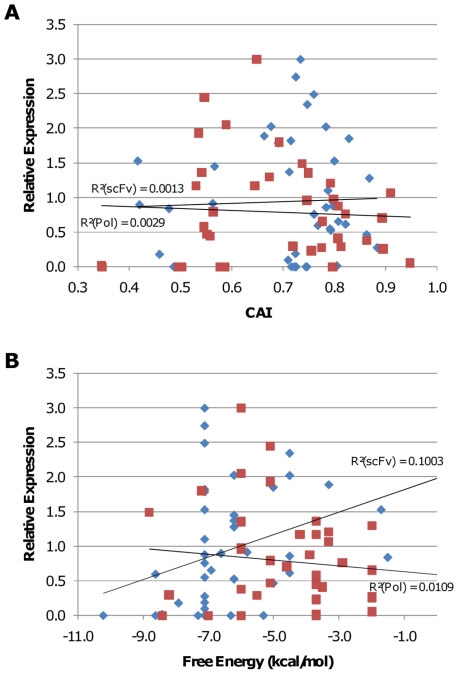
Figure 3. Expression is not predicted by Codon Adaptation Index or mRNA structure.
The codon adaptation index [7] (part A) and the strength of mRNA secondary structure from position −4 to +38 relative to the initiating AUG (part B) were calculated for each variant synthesized in this study and plotted against the expression level measured for that variant. Blue diamonds indicate scFv variants. Red squares indicate polymerase variants. Expression levels are normalized to highest expressing variant for each set (equal to 3).

