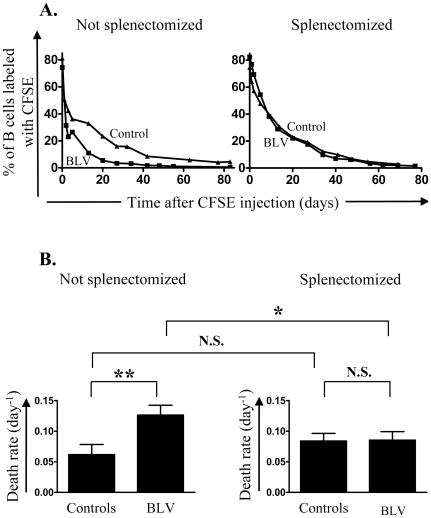
Figure 2. Evaluation of death rates in vivo.
CFSE was injected intravenously in BLV infected sheep and in non infected controls. At regular interval of time, the percentage of B lymphocytes labeled with CFSE was determined by flow cytometry. A mathematical model was fitted to in vivo CFSE labeling data in B lymphocytes and death rates were estimated. Not splenectomized (left panels) and splenectomized (right panels) animals were analyzed. (A) Percentages of B cells labeled with CFSE in BLV-infected (▪) and control (▴) sheep. (B) Mean values (±SD) of death rates. CFSE was injected in 7)infected sheep, 3 of them being splenectomized and 7 controls, 3 of them being splenectomized. Statistical relevance (n.s., not significant; p<0.05, statistically significant*; p<0.01, highly statistically significant**) was calculated according to the unpaired two-tailed student t test with Welch's correction.

