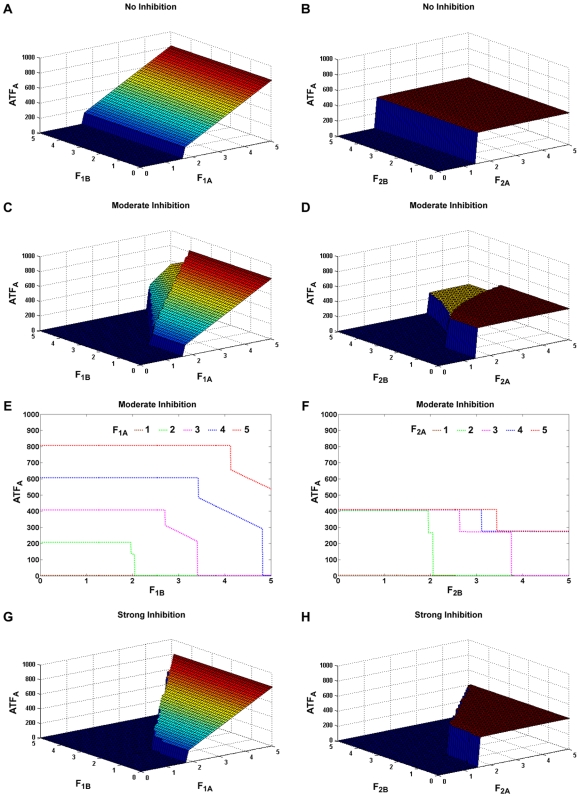
Figure 2. Effect of the positive feedback loops on the on-state ATFA levels.
A. Strengths of the autofeedback loops (F1A and F1B) are varied for both lineages and the steady-state values of ATFA are plotted for the no inhibition condition (KIA = KIB = ∞), keeping the strengths of the receptor feedback (F2) constant. B. Strengths of the receptor feedback loops (F2A and F2B) are varied and the values of ATFA are plotted for the no inhibition condition, keeping the strengths of the autofeedback (F1) constant. C. Same as part A except with moderate inhibition (KIA = KIB = 400 molecules). D. Same as part B except with moderate inhibition. E. Cross-sectional plot from C for various values of F1A. F. Cross-sectional plot from D for various values of F2A. G. Same as part A except with strong inhibition (KIA = KIB = 50 molecules). H. Same as part B except with strong inhibition. No inhibition and strong inhibition give rise to only on or off populations, whereas moderate inhibition can generate a third intermediate population.

