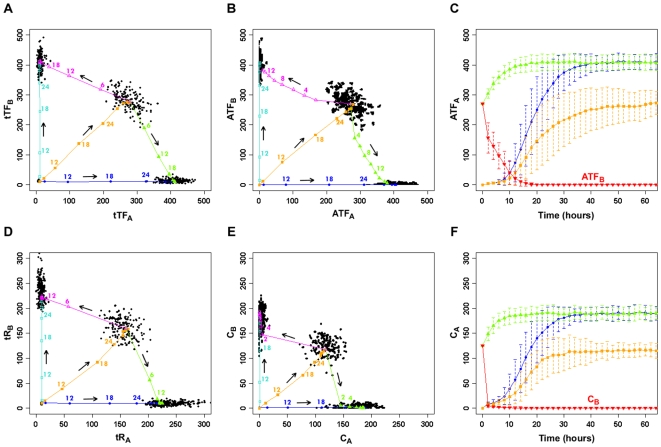
Figure 5. Time trajectories during lineage commitment.
A. Phase plot of total transcription factor (ITF+ATF) for the four steady-state populations (uncommitted, A, B, and bipotent). B. Phase plot of active transcription factor (ATF). C. Time trajectories for ATFA in panel B for the transition from the uncommitted cell to committed A state (blue line) and bipotent state (orange line) and from the bipotent state to committed A state (green line). The error bars represent the standard deviation of the mean. The red line shows the level of ATFB as the bipotent cell transitions to the committed A state. D. Phase plot of total receptor (R+C). E. Phase plot of active complex (C). F. Time trajectories for CA in panel E for the transition from the uncommitted cell to committed A state (blue line) and bipotent state (orange line) and from the bipotent state to committed A state (green line). The error bars represent the standard deviation of the mean. The red line shows the level of CB as the bipotent cell transitions to the committed A state. In the phase plots, the arrows indicate the direction of commitment (averaged over 200 stochastic runs each): from the uncommitted state, the three possible commitment trajectories lead to pure lineage A, pure lineage B, and the bipotent state. In separate simulations starting with the bipotent state and with initial ligand concentrations sufficient to destabilize this state, the two possible commitment trajectories lead to pure lineage A and pure lineage B. Each trajectory has several nodes and the number at each node denotes the average time (in hours) it takes to reach the node from the initial state. Each black dot in A, B, D and E represents the endpoint (100,000 min) of an individual stochastic trajectory. The initial conditions for the trajectories are provided in the Supplementary Text S1.

