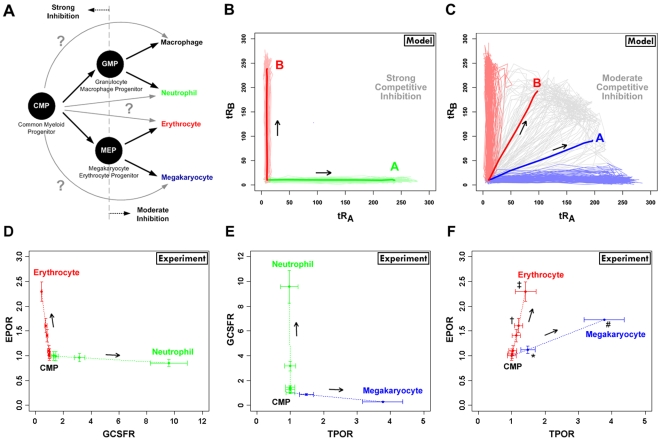
Figure 6. Comparison of multilineage commitment model to experimental data.
A. The classical model of hematopoiesis is given here as a branching diagram showing the differentiation paths from the common myeloid progenitor (CMP) to four distinct myeloid lineages (megakaryocyte, erythrocyte, neutrophil, and macrophage) via bipotent progenitors (GMP – granulocyte/macrophage progenitor and MEP – megakaryocyte/erythrocyte progenitor). Potential non-canonical routes of commitment, bypassing the bipotent state, are shown as gray arrows. B. Stochastic simulations of total receptor levels under strong competitive inhibition. Light green and red lines indicate the individual trajectories from the uncommitted cell to lineages A and B, respectively. The dark red and green lines denote the averaged trajectories of all stochastic runs. C. Stochastic simulation for total receptor levels under moderate competitive inhibition condition. Light blue, light red, and gray lines indicate the individual trajectories from the uncommitted cell to A, B, and the bipotent state, respectively. The dark blue line denotes the average value of all stochastic runs that commit to either lineage A or the bipotent state; the dark red line denotes the average value of all stochastic runs that commit to either lineage B or the bipotent state. D. Trajectories from microarray data showing upregulation of EPOR and GCSFR during erythrocyte (red) and neutrophil (green) commitment from the CMP, respectively. E. Trajectories from microarray data showing upregulation of TPOR and GCSFR during megakaryocyte (blue) and neutrophil (green) commitment from the CMP, respectively. F. Trajectories from microarray data showing upregulation of EPOR and TPOR during erythrocyte (red) and megakaryocyte (blue) commitment from the CMP. The trajectories in D–F represent the average of the multipotent, bipotent, and mature cells for a single lineage (see Supplementary Table S4), thus enabling a direct comparison to the model simulations. The error bars in D–F show the standard error of the mean. The symbols in F denote the 3-day (†, *) and 7-day (‡, #) time points during erythrocyte and megakaryocyte differentiation from the CMP, respectively. Statistical analysis was performed to deduce positive correlation in receptor pair upregulation by comparing the overall slope of each trajectory (inverted to lie along the x-axis, if appropriate) at both the 3-day and 7-day time points to a value of zero (no correlation) by a one-sample, one-tailed t-test (p-values: † (0.027), * (0.009), ‡ (0.060), # (0.008)).

