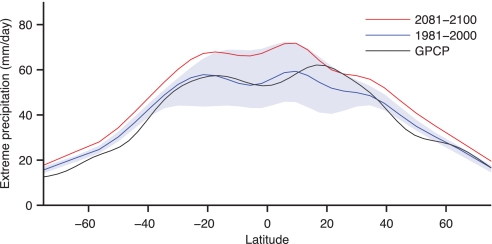
Fig. 1.
The 99.9th percentile of daily precipitation (millimeters per day) for the periods 1981–2000 (blue) and 2081–2100 (red) in the SRES A1B scenario (multimodel median), and based on Global Precipitation Climatology Project (GPCP) data for the period 1997–2006 (black). Model scatter (shading) for the period 1981–2000 is shown using the interquartile range (50% of models lie within the shaded region). The spatial resolution of the GPCP data were degraded from 1° to 3°, which is comparable with climate model resolutions. A Gaussian smoothing filter of standard deviation 6° latitude was applied to reduce noise in all plots showing variations with latitude.

