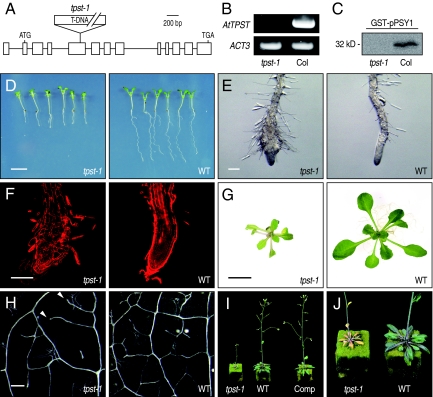
Fig. 4.
Phenotypes of a loss-of-function mutant of AtTPST. (A) Schematic map of the T-DNA insertion site of tpst-1 (SALK_009847). (B) Absence of AtTPST transcripts in homozygous tpst-1 plants. RT-PCR analyses were performed on total RNA extracted from tpst-1 or WT plants by using primers specific for AtTPST or for the Arabidopsis ACT3 gene (used as a control). (C) Absence of TPST activities in homozygous tpst-1 plants. GST-pPSY1 was incubated with [35S]PAPS in the presence of solubilized Arabidopsis microsomal fractions derived from tpst-1 or WT plants and analyzed by SDS/PAGE followed by autoradiography. (D) Vertically grown 7-day-old seedlings of tpst-1 and WT. (Scale bar, 5 mm.) (E) Close-up of RAM in D. (Scale bar, 200 μm.) (F) Confocal images of RAM in D stained with propidium iodide. (Scale bar, 200 μm.) (G) Three-week-old plants of tpst-1 and WT grown on B5 agar plates. (Scale bar, 1 cm.) (H) First leaf of tpst-1 and WT cleared by chloral hydrate. In tpst-1 leaves, secondary veins often do not close (indicated by arrows). (Scale bar, 200 μm.) (I) Four-week-old plants of tpst-1, WT, and tpst-1 complemented with AtTPST. (J) Five-week-old plants of tpst-1 and WT.

