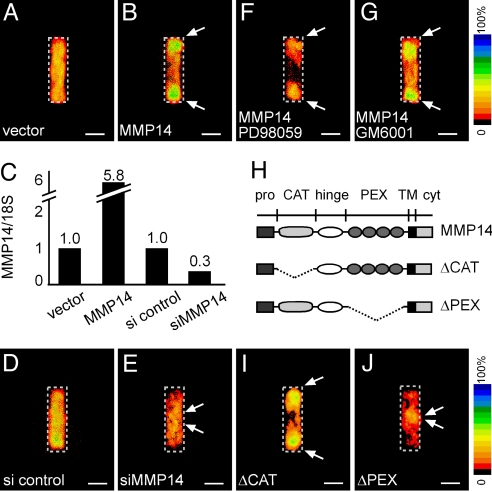
Fig. 2.
Tubules mosaic for MMP14 spontaneously self-organize. Frequency map quantifying location of YFP-expressing cells co-transfected with control vector (A) and mouse MMP14 (B). (C) Quantitative RT/PCR analysis for MMP14 expression in cells transfected with control vector, MMP14, siRNA control (si control), and siRNA against MMP14 (siMMP14), normalized to levels of 18S rRNA. Frequency maps quantifying location of YFP-expressing cells co-transfected with siRNA control (si control) (D) and siRNA against MMP14 (siMMP14) (E). Sorting does not require signaling through Erk or MMP proteolytic activity: frequency maps quantifying location of YFP-expressing cells co-transfected with MMP14 and treated with MEK inhibitor PD98059 (F) or broad-spectrum MMP inhibitor GM6001 (40 μM) (G). (H) Diagram of MMP14 constructs with the catalytic domain deleted (ΔCAT) or the hemopexin domain deleted (ΔPEX). Frequency maps quantifying location of YFP-expressing cells co-transfected with ΔCAT (I) or ΔPEX (J) demonstrate that sorting requires the hemopexin domain but is independent of the catalytic domain of MMP14. (Scale bars, 50 μm.)

