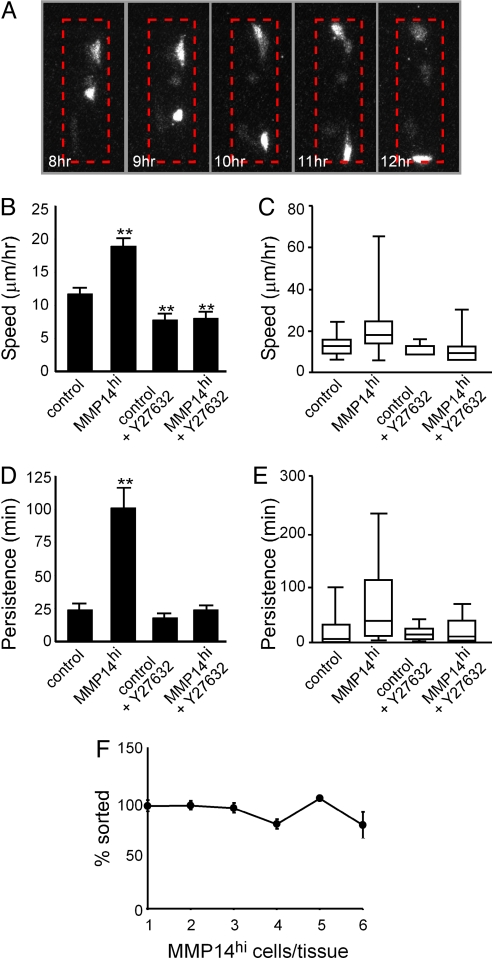
Fig. 4.
MMP14 expression causes sorting by increasing cell motility. (A) Montage of 5 time points (among ≈90 frames over 20 h) of a single z-section in one mosaic tubule. Shown is the MMP14hi/CFP channel. Dashed red line indicates region of tubule. (B) Average speed of individual control cells, MMP14hi cells, and control and MMP14hi cells in tubules treated with the ROCK inhibitor Y27632. (C) Distribution of cell speed among populations in B. (D) Persistence time of individual control cells, MMP14hi cells, and control and MMP14hi cells in tubules treated with the ROCK inhibitor Y27632. (E) Distribution of persistence time among populations in D. (F) Graph of cell sorting as a function of MMP14hi cells within the tubule. For B, D, and F, error bars indicate SEM of 3 independent experiments. For C and E, edges represent 25th and 75th percentiles and error bars represent 10th and 90th percentiles. **P < 0.005 vs. controls, as determined by t test.

