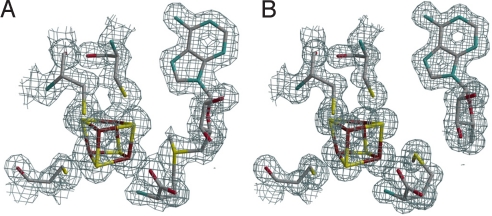
Fig. 2.
Active site X-ray structures. 2Fo-Fc electron density maps on the x-ray model of (A) AdoMet-bound HydE and (B) [5′-dA + Met]-bound HydE. Map contours were drawn at the 1 σ level with a cover radius of 1.8 Å. The three cysteine residues, the iron sulfur cluster and AdoMet or [5′-dA + Met] are represented as sticks; C gray, Fe brown, N blue, O red, S yellow.

