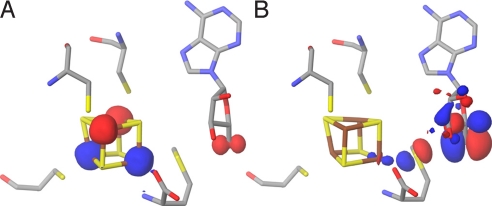
Fig. 4.
Transition state. (A) The spin density at the active site of the QM/MM-optimized structure of the transition state. (B) HOMO at the active site of the QM/MM-optimized structure of the transition state (surfaces in red [+] and blue [-]; atom color codes are as in Fig. 1).

