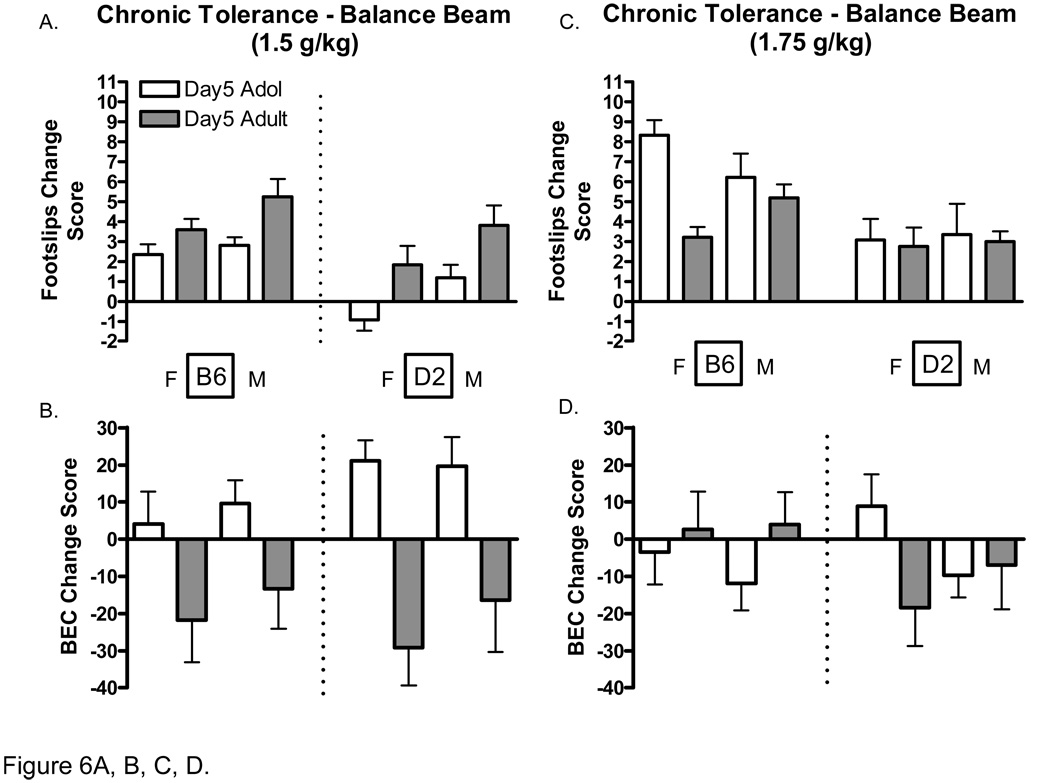
Figure 6.
Development of chronic tolerance to ethanol-induced ataxia (1.5 and 1.75 k/kg) in adolescent and adult C57BL/6J and DBA2/J mice. A. Change in the number of footlslips in adolescent and adult mice (1.5) on day 5 compared to day 1. B. Change in Blood ethanol concentrations after performance on the balance beam (1.5 g/kg) on day 5 compared to day 1. C. Change in the number of footlslips in adolescent and adult mice (1.75) on day 5 compared to day 1. D. Change in Blood ethanol concentrations after performance on the balance beam (1.75 g/kg) on day 5 compared to day 1. Footslip change scores were calculated by subtracting the 1st day values from those of day 5. BEC change scores were calculated by subtracting the 5th day values from those of day 1. Positive footslip change scores represent decreases in footslips. Positive BEC change scores represent increases in rates of ethanol absorption (BEC).

