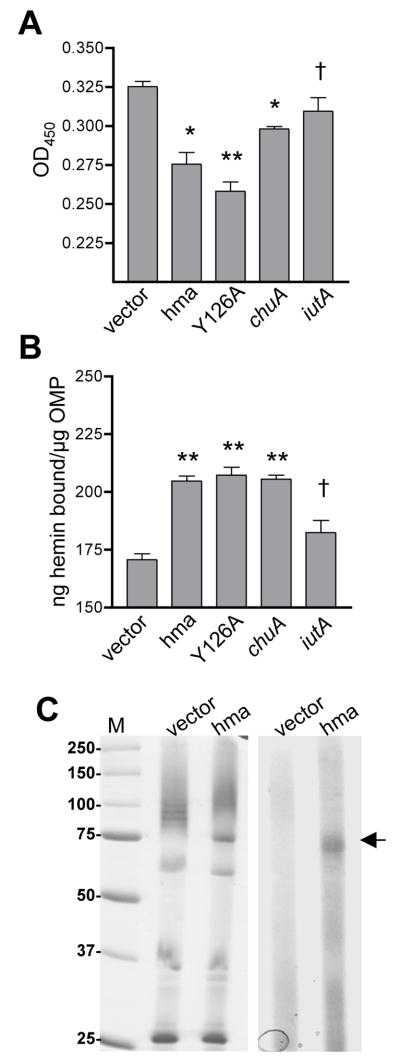
Fig. 3. Hemin binding activity of Hma.
(A) Hemin binding to E. coli K12 carrying phma, pY126A, pchuA, piutA, or vector control. Induced cells were incubated with 50 μM hemin, pelleted, and hemin remaining in the supernatant detected with a peroxidase substrate. **P<0.0001, *P≤0.001, † not significant (as compared to vector control).
(B) Hemin binding to outer membrane proteins isolated from the strains in (A), as measured by microtiter plate assay. Wells were coated with 0.5 μg protein and incubated with 50 μM hemin. Unbound hemin was removed by washing and, after the addition of a peroxidase substrate, hemin binding was calculated from a standard curve using the OD450. Bars represent the mean (n≥5) and symbols are as in (A).
(C) Hemin binding to Hma protein. OMPs isolated from the strains in (A) were incubated with 85 μM hemin and separated on a non-reducing SDS-PAGE gel. Left panel is Coomassie stained gel and right panel is TMBZ stain of heme-associated peroxidase activity. Arrow indicates Hma band. M, molecular weight standards in kDa.

