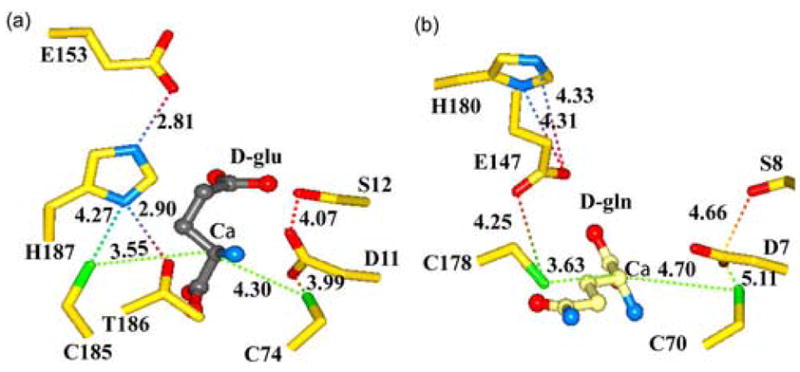
Figure 5.

Comparison of the active sites of B. anthracis RacE2 with that of RacE from A. pyrophilus. (a) RacE2 active site with D-glutamate bound (grey). The conformation of residues H187 and G153 in the RacE2 structure is notably different from that of A. pyrophilus RacE. The possible interactions between the catalytic residues and other residues in the immediate vicinity are shown by dotted lines with distances given in Angstroms. (b) Active site of A. pyrophilus RacE with D-glutamine bound in the reverse orientation with its side chain pointing away from the active site pocket.
