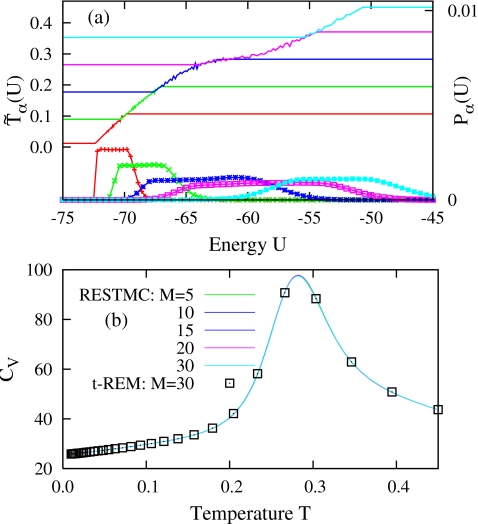
Figure 1.
(a) Statistical temperatures, (lines), and energy distributions, Pα(U) (lines points), of RESTMC simulation with M=5 for LJ19 and (b) heat capacities determined by RESTMC simulations with varying M for 108 MC cycles and t-REM with M=30 for 109 MC cycles. α=1–5 in (a) from bottom to top. The magnitude of Pα(U) in (a) has been adjusted for visualization.

