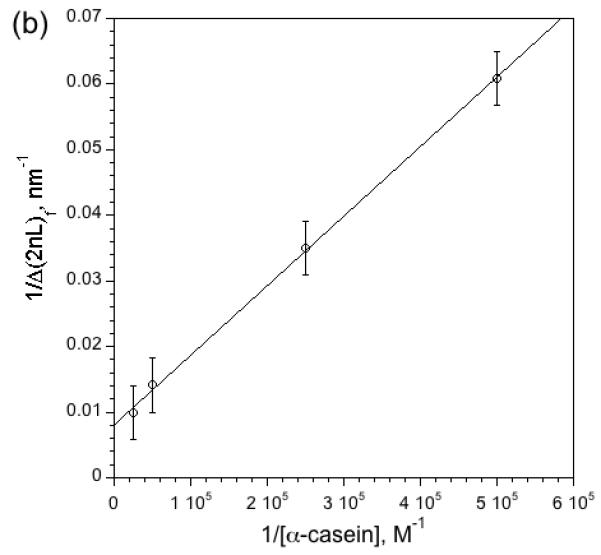
Figure 4. Kinetics of digestion of α-casein by pepsin in the nanoreactor as a function of casein concentration.

(a) Appearance of digestion products in Layer 2 of the nanoreactor as a function of time, measured as the change in optical thickness of the layer. The action of pepsin on α-casein generates small peptide fragments that enter Layer 2. The quantity Δ2nL represents the change in 2nL relative to its value immediately before introduction of casein, nominally 16,000 nm for this series of experiments. The initial slope of the curves and the steady-state values of Δ(2nL) correlate with the initial concentration of casein used in each experiment. The slight kink in the 40 μM curve at early times is attributed to the very high concentration of substrate, which interferes with diffusion in the micropores of Layer 2. (b) Double reciprocal plot of Δ(2nL)f and [α-casein], where Δ(2nL)f is the final, steady-state value of Δ(2nL) measured 140 min after introduction of α-casein. Each data point represents triplicate measurements.

