
Figure 2. Asymmetric distribution of mPar3 in dividing radial glial cells in anaphase/telophase.
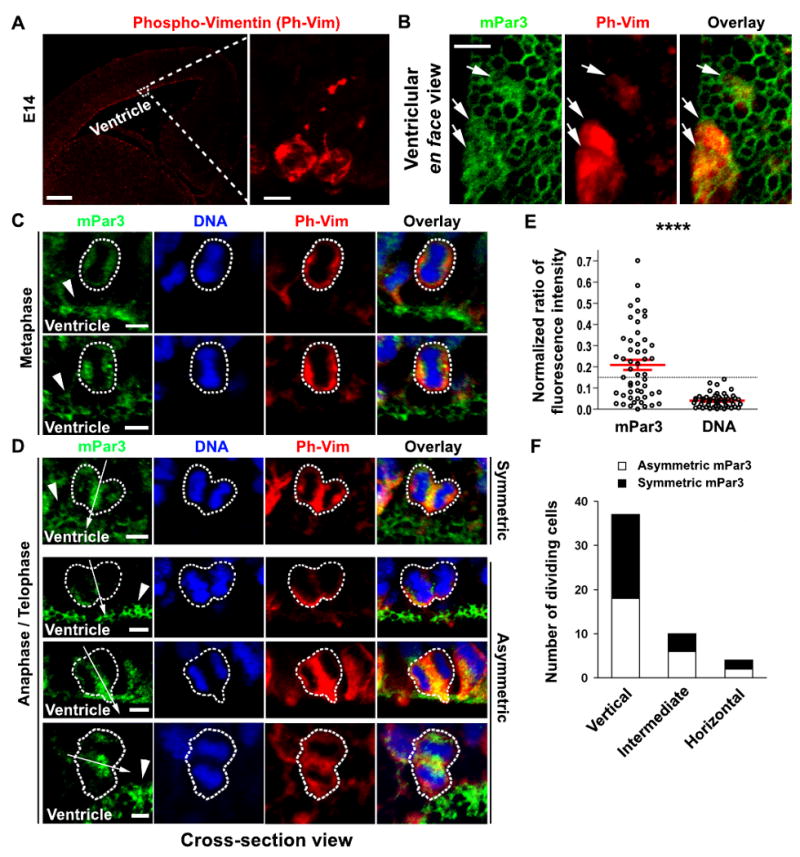
(A) Images of E14.5 cortices immunostained with the antibody against phospho-Vimentin (Ph-Vim, red). High magnification image of the outlined region is shown to the right. Note that the Ph-Vim antibody selectively labels dividing cells in the developing neocortex and reveals their morphology. Scale bars: 250 μm and 10 μm. (B) High magnification ventricle en face images of mPar3 (green) and Ph-Vim (red) at the luminal surface of the VZ. Note a correlation between diffuse mPar3 immunofluorescence and Ph-Vim staining (arrows). Scale bar: 5 μm. (C) Subcellular localization of mPar3 (green) in metaphase radial glial cells labeled by Ph-Vim (red) with condensed DNA staining (blue). Arrowheads indicate mPar3 expression in interphase radial glial cells at the luminal surface of the VZ. Scale bar: 5 μm. (D) Subcellular localization of mPar3 (green) in anaphase/telophase radial glial cells labeled by Ph-Vim (red) with condensed, separated chromosomes (blue). Arrows indicate the cleavage plane and arrowheads indicate mPar3 expression in nearby interphase radial glial cells. Broken lines indicate the contour of dividing radial glial cells. Note that mPar3 is either symmetrically or asymmetrically distributed with respect to the cleavage plane. Scale bar: 5 μm. (E) Quantification of the normalized ratio of mPar3 immunofluorescence and DNA labeling in anaphase/telophase radial glial cells with respect to the cleavage plane. Black circles represent individual cells and red lines represent the average and s.e.m. The broken line indicates the threshold of mPar3 asymmetry. ****, p<5e-6. (F) Quantification of the number of radial glial cells in anaphase/telophase that display mPar3 asymmetry with respect to the orientation of the cleavage plane.