
Figure 5. mPar3 regulates endogenous Notch signaling activity in the developing neocortex.
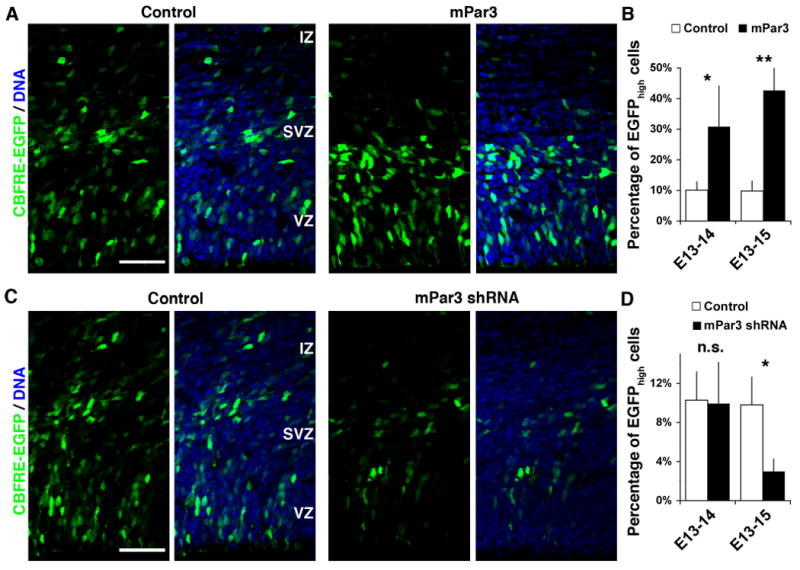
(A, B) Ectopic expression of mPar3 enhances endogenous Notch signaling activity. (A) Images of cortices expressing CBFRE-EGFP (green) together with control (left) or mPar3 (right) counterstained with a DNA dye (blue). Note that ectopic expression of mPar3 leads to an increase in EGFP expression, primarily in the VZ. Scale bar: 50 μm. (B) Quantification of the percentage of EGFPhigh cells in the developing neocortex (E13-14: Control, 236 cells from five animals; mPar3, 289 cells from five animals; E13-15: Control, 770 cells from five animals; mPar3, 555 cells from five animals). *, p<0.05; **, p<0.005. (C, D) Suppression of mPar3 expression decreases endogenous Notch signaling activity. (C) Images of cortices expressing CBFRE-EGFP (green) together with either Control shRNA (left) or mPar3 shRNA (right) counterstained with a DNA dye (blue). Note that suppression of mPar3 expression causes a decrease in EGFP expression. Scale bar: 50 μm. (D) Quantification of the percentage of EGFPhigh cells in the developing neocortex (E13-14: Control shRNA, 565 cells from five animals; mPar3 shRNA, 204 cells from four animals; E13-15: Control shRNA, 2,030 cells from seven animals; mPar3 shRNA, 2,123 cells from seven animals). n.s., not significant; *, p<0.05.