
Figure 7. Notch signaling activity is required for mPar3 function.
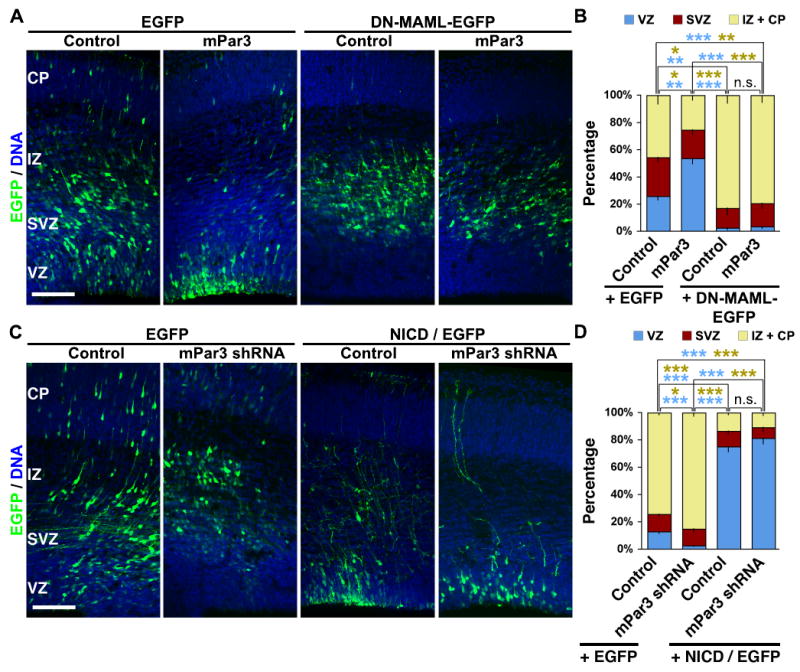
(A, B) DN-MAML suppresses the effect of mPar3 ectopic expression on neurogenesis. (A) Images of cortices expressing EGFP/Control, EGFP/mPar3, DN-MAML-EGFP, and mPar3/DN-MAML-EGFP (green) counterstained with a DNA dye (blue). Note that ectopic expression of mPar3 restricts cells to the VZ and this is suppressed by co-expression of DN-MAML. Scale bar: 200 μm. (B) Quantification of the distribution of EGFP-expressing cells in the developing neocortex (E13-15: Control, 945 cells from three animals; mPar3, 279 cells from four animals; DN-MAML-EGFP, 638 cells from three animals; mPar3/DN-MAML-EGFP, 370 cells from four animals). *, p<0.05; **, p<0.005; ***, p<5e-4; n.s., not significant. (C, D) NICD suppresses the effect of mPar3 depletion on neurogenesis. (C) Images of cortices expressing EGFP/Control shRNA, EGFP/mPar3 shRNA, EGFP/Control shRNA/NICD, and EGFP/mPar3 shRNA/NICD (green) counterstained with a DNA dye (blue). Note that suppression of mPar3 expression causes cells to exit the VZ and this is suppressed by co-expression of NICD. Scale bar: 200 μm. (D) Quantification of the distribution of EGFP-expressing cells in the developing neocortex (E13-16: Control, 1,504 cells from four animals; mPar3 shRNA, 863 cells from five animals; NICD, 500 cells from three animals; mPar3 shRNA/NICD, 239 cells from four animals). *, p<0.05; **, p<0.005; ***, p<5e-4; n.s., not significant.