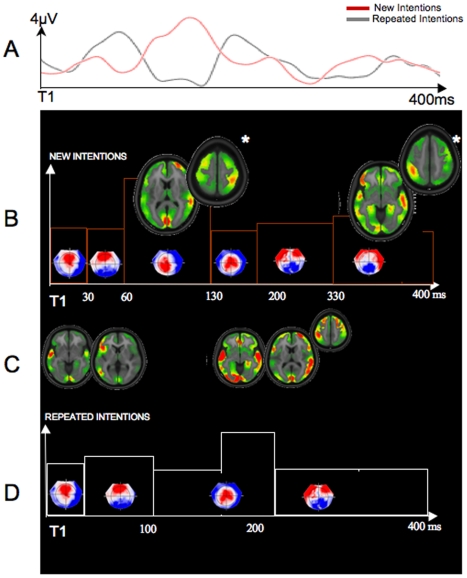
Figure 4. Electrical neuroimaging results for intentions.
A. Schematic representation of the global field power for new intentions (NI; in red) and repeated intentions (RI; in black) from T1 to 400 ms post-T1. B. The microstate analysis identified a total of six time periods of stability for NI. NI-Map 1: 0–30 ms; NI-Map 2: 32–60 ms; NI-Map 3: 62–130 ms; NI-Map 3: 132–200 ms; NI-Map 4: 202–330 ms; NI-Map 4: 332–400 ms. For the RI, only four time periods of stability were detected, i.e., RI-map 1: 0–30 ms; RI-Map 2: 32–100 ms; RI-Map 3: 102–240 ms; RI-Map 4: 242–400 ms. The main differences between NI and RI conditions were observed at two different time intervals: i) between 62 and 130 ms; and ii) between 332 and 400 ms post hand-on-object interaction. Here, maps are represented on top of schematic representation of GFP. All topographies are shown with the nasion upward and left scalp leftward. LAURA source estimations of these two intervals were characterized by right-lateralized activations including right STS (local maximum: right posterior STS: 60,−37,7; x, y, z mm Talairach coordinates) and bilateral aIPS (local maximum: right aIPS: 39,−37,54; x, y, z mm Talairach coordinates) for the first interval, and the recruitment of a distributed brain network, mostly in the left aIPS (local maximum: −40,−43,48; x, y, z mm Talairach coordinates), right MTG/STS (local maximum: −53,−55,17; x, y, z mm Talairach coordinates), left IFG (local maximum: −48,33,−3; x, y, z mm Talairach coordinates) for the second interval. Differential activations between NI (B) and RI (D) are represented on top of the schematic representation of the GFP. C. Common LAURA brain source estimations for both NI and RI conditions are shown here. These brain source estimations were localized within anterior MTG/STS, bilateral occipital region, temporo-occipital region, and anterior cingulate.

