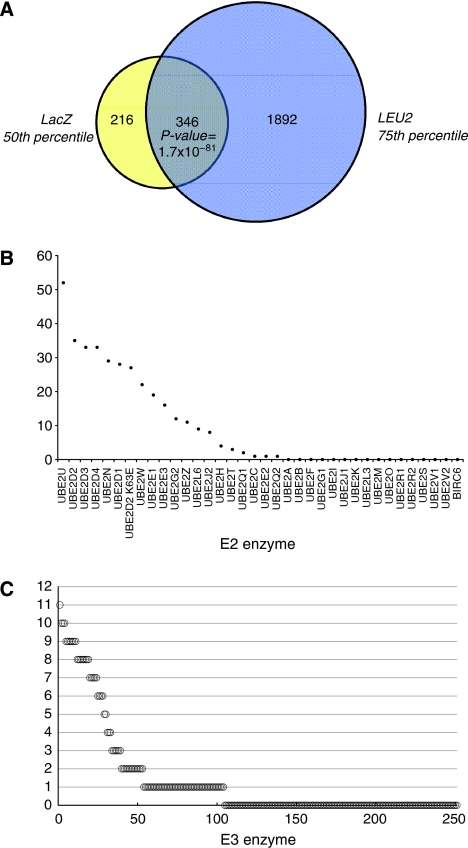
Figure 2.
Topological characterization of the E2–E3 network. (A) Venn diagram showing the shared E2–E3 interactions in the 75th percentile selected LEU2-set and the 50th percentile selected LacZ-set and the overlap between them. (B) Distribution of the E3 connectivity for each individual E2. Depicted are the numbers of E3 interactions observed in the shared LacZ- and LEU2-set among all interactions of a single E2. (C) Distribution of the E2 connectivity for each individual E3, idem as panel B.

