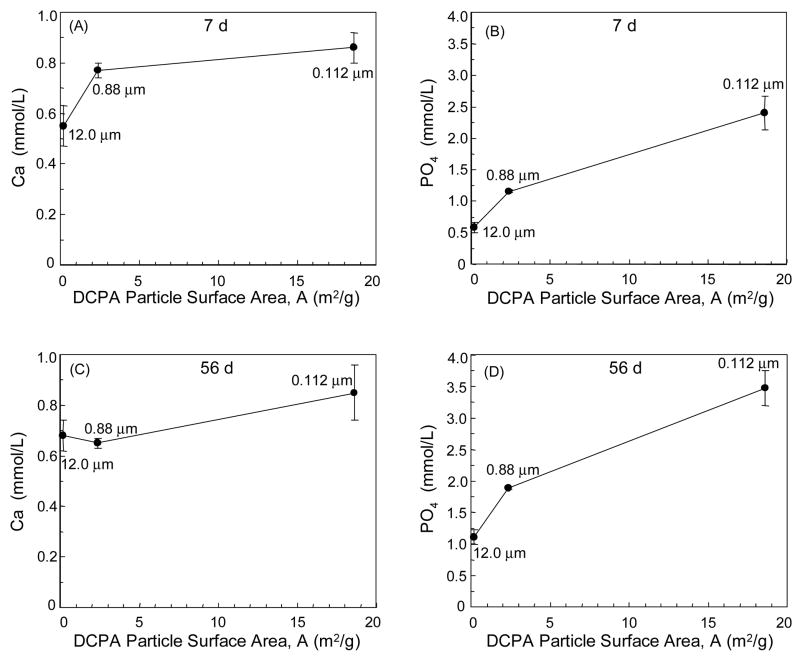
Figure 6.
Effect of DCPA particle surface area on Ca and PO4 release for composite containing unsilanized nano DCPA at DCPA:whisker of 1:0. The particle specific surface area was calculated by A = 6/(d ρ), where d is diameter and ρ is density (2.89 g/cm3 for DCPA). (A–B) Initial Ca and PO4 release from Fig. 4A and 4C (7-day data). (C–D) 56-d release data from Fig. 4A and 4C. Each Ca and PO4 concentration value is mean ± sd; n = 3. Smaller particles with a larger surface area had more ion release.

