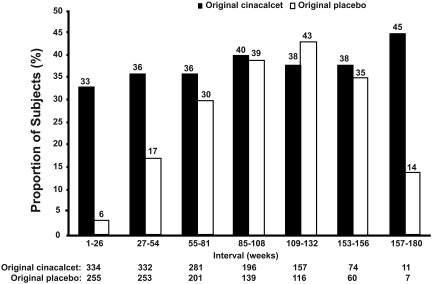
Figure 5.
Proportion of subjects achieving PTH ≤300 pg/ml and Ca×P ≤ 55 mg2/dl2 at each 6-mo period. Reductions in PTH and Ca×P values were calculated against the mean PTH or Ca×P values, respectively, over the 6-mo period. Some scheduled visits were shifted up to a maximum of 2 wk to align with the closest week indicated in the table. N, number of subjects entering period.

